Material Technology

เครื่องมือวิเคราะห์ทางกายภาพ Material Technology

SEM_JSM-IT500

JSM-IT500 InTouchScope™ Scanning Electron Microscope

Image

3 key points Fast and Easy Analysis!

Image

Key point 1 : Zeromag

The displayed Holder Graphics or CCD image enables you to locate the specimen area or specify analysis positions. You can rapidly search the specimen area and specify positions for multiple-field serial analysis.

Key point 2 : Live Analysis (Only for A/LA)

With "Live Analysis", the embedded EDS system shows a real time EDS spectrum during image observation. Elemental composition or "Alert" for element of interest is displayed on a live image.

Key point 3 : Integrated data management software

This user-friendly software enables you to select and review SEM images and analysis results through the data management area. You can also generate a report with a single click.

Key point 1 : Zeromag for True Integration of Optical and SEM imaging

Smooth operation up to high magnification observation!
"Zeromag" facilitates navigation with seamless transitioning from the optical CCD image to SEM image.
Image
With Zeromag, automated simple large-area observation and EDS analysis can be made.
Image
Montage setup with Zeromag.
Image
Image
Montage result: 4 x 4
(Left: Backscattered electron composition image, Right: Ca map)
Specimen: Concrete.  Accelerating voltage: 15 kV
High-vacuum mode.  Area: Approx. 4 mm x 3 mm

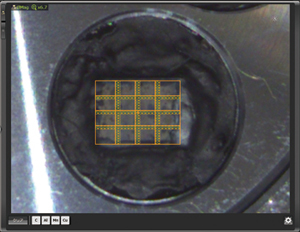
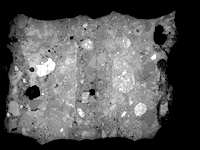
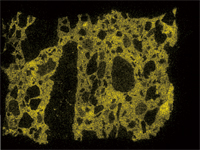
With Zeromag, it is easy to set up one or more montage areas for imaging and analysis. “Montage” function is effective to acquire detailed information for identifying foreign materials over large areas.

Key point 2 : Live Analysis - Seamless SEM and EDS -

With our analytic series (Live Analysis), the EDS system shows a real time EDS spectrum during image observation. You will easily find elements of interest and unexpected elements.
Image

Element
The main elements existing in the measurement area are displayed. You can display “Alert” by specifying an element.

Spectrum 
The characteristic X-ray spectrum from the analysis area and automatic qualitative analysis results are always displayed.

Single-click enables you to switch between the Electron microscope operation screen and analysis detail display screen.

Key point 3 : Integrated data management software SMILE VIEW™ Lab for Seamless report generation

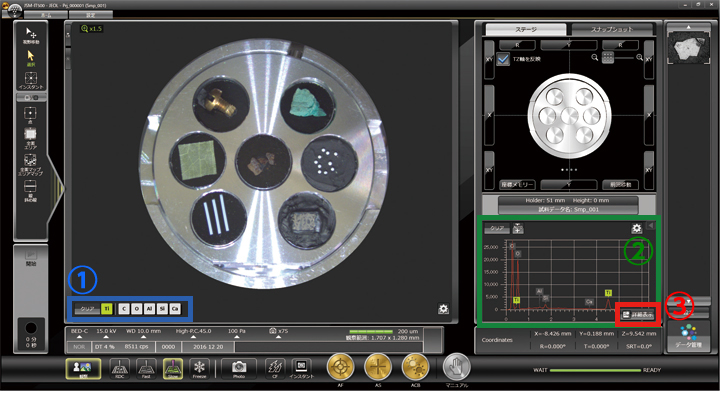
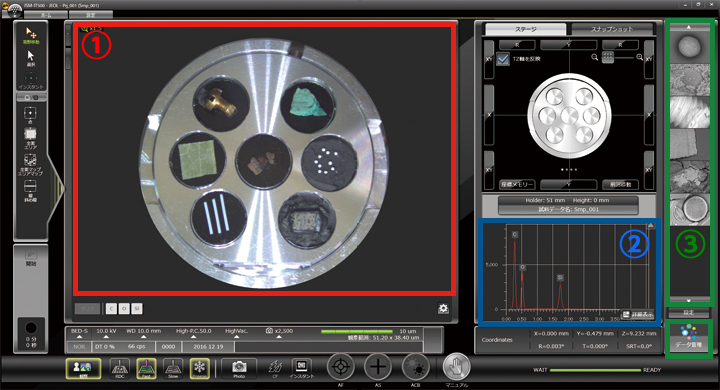
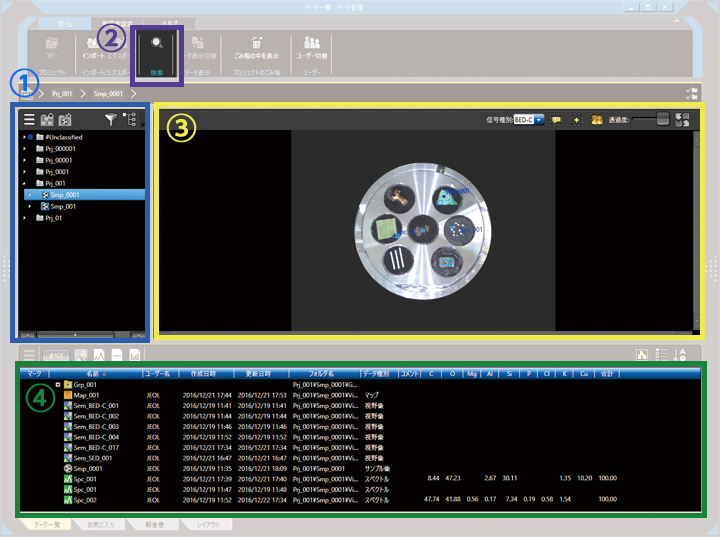
SMILE VIEW™ Lab is a fully integrated data management software which links the CCD image, SEM images, EDS analysis results and corresponding stage coordinates for fast report generation or re-call of specimen position for further study.


Names of each field are displayed. 
Image

Data search is enabled from specimen name, creation time, data type, etc.
Image

Positions of each field are displayed on Holder Graphics or CCD image.

Data is displayed in list form, which includes analysis data, quantitative analysis results of elemental map, spectra, etc., in the selected fields.
Image

Contact us

Syntech Innovation Co., Ltd.
388/5 Nuanchan Road, Nuanchan,
Buengkum, Bangkok 10230

0 2363 8585 (auto)

0 2363 8595

081 498 9939

1865254
Today
Yesterday
This Month
All days
836
1713
37095
1865254

Your IP: 3.145.93.221
2024-04-26 07:45

Link