

 |
 |
 |
The analysis of biological tissues typically is performed using microscopic methods.
Infrared Microspectroscopic Imaging of Biological Samples
The analysis of biological tissues typically is performed using microscopic methods. Due to the lack of visual contrast, staining procedures are required in order to highlight any structures of interest. Moreover, for the speci c visualization of components (e.g., proteins, carbohydrates, lipids) and of patterns indicating diseases (e.g., cancer, neurodegeneration) simple staining methods using dyes are usually not suf cient and immunohistochemical (IHC) staining is used. This staining method applies antibodies, which speci cally bind to antigens in the tissue sample. In principle, this method is quite effective and very sensitive. However, the sample preparation procedure is very time consuming and complex resulting in many potential sources of errors. Serious drawbacks are cross-reactions leading to strong background staining and a weak staining of the target antigen both of which lead to an insuf cient contrast.
FT-IR microscopy constitutes a very fast and ef cient alternative to the well-established staining methods. It allows to analyze biological samples with minimal sample preparation and without the need for any agents for contrast enhancement. The measured spectrum is a result of the interaction of IR-light with the sample and re ects its biochemical composition.
By using multi-element focal plane array (FPA) detectors it is possible to measure thousands of spectra simultaneously with a lateral resolution only limited by the diffraction of light. The result of an FPA measurement is a spectral matrix bearing complex information about the chemical composition of the measured sample area. For the analysis,evaluation methods like integration, cluster analysis or principal component analysis are applied. The resulting so called “chemical images”, visualize the distribution of individual chemical components or certain spectral characteristics of the tissue and can be superimposed with the visual microscopic image.
FT-IR imaging reveals the chemical nature of biological structures and identifies proteins, lipids, polysaccharides etc. In many scientific studies, it has been shown thatthe method allows to differentiate between cancer cellsand normal cells. Additionally, different structural forms of proteins (α-helix, β-sheet and random coil) and fatty acids (degree of unsaturation) can be discriminated. Thereby valuable information about neurodegenerative diseases like Alzheimer is generated, since the histological patterns of cell-damage can be precisely localized and identi ed. So far, IR-imaging is used exclusively for research purposes. In the future, the scienti c community expects the method to become a powerful tool in medical diagnostics, providing faster results that are more objective when compared to the current staining techniques.
Differentiation of healthy and cancerous areas in breast tissue
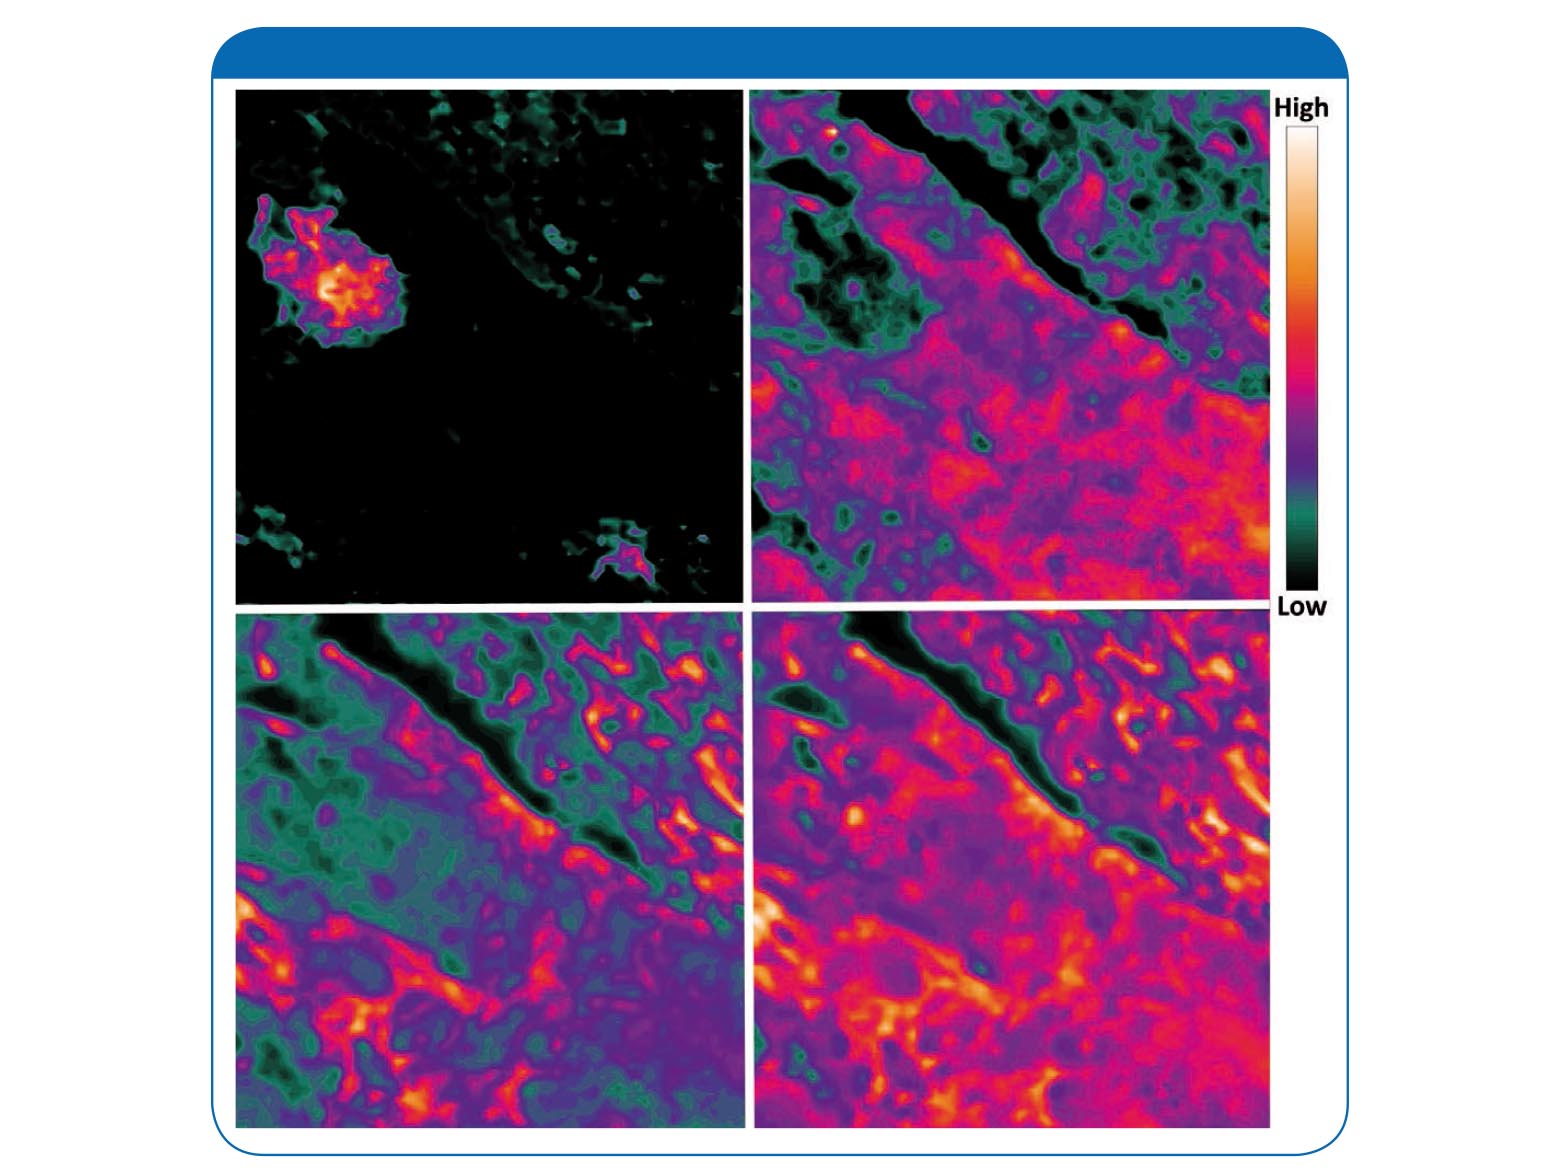
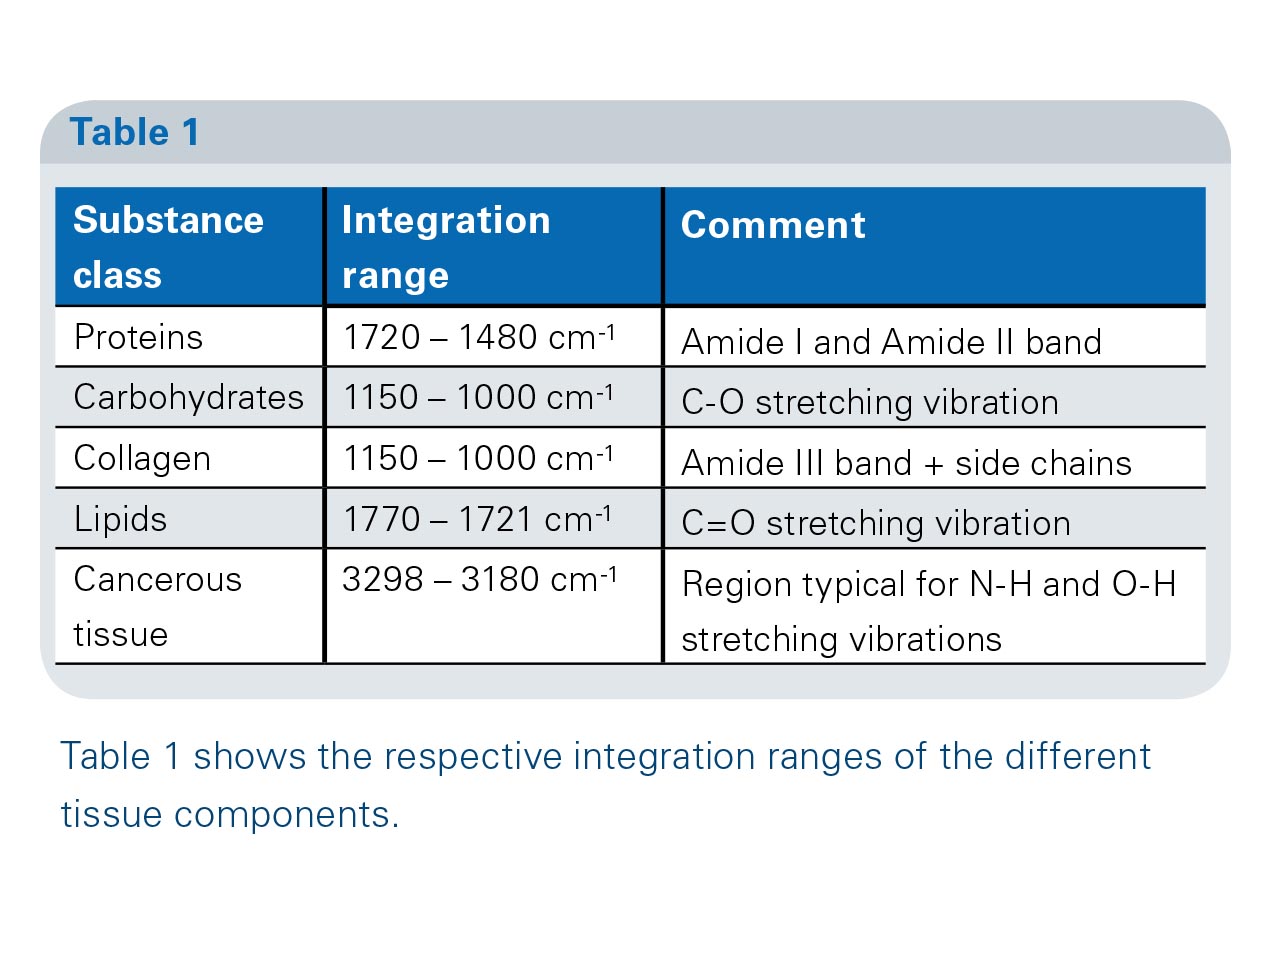
Figure 2 shows color coded chemical images that were created by integrating certain band positions of the IR imaging spectra which are characteristic for individual biological components or special properties (as in the case of the cancer cells). The color coding shows the intensity of the respective band: Black stands for the lowest values followed by green, blue/violet, red, and white for the highest values.
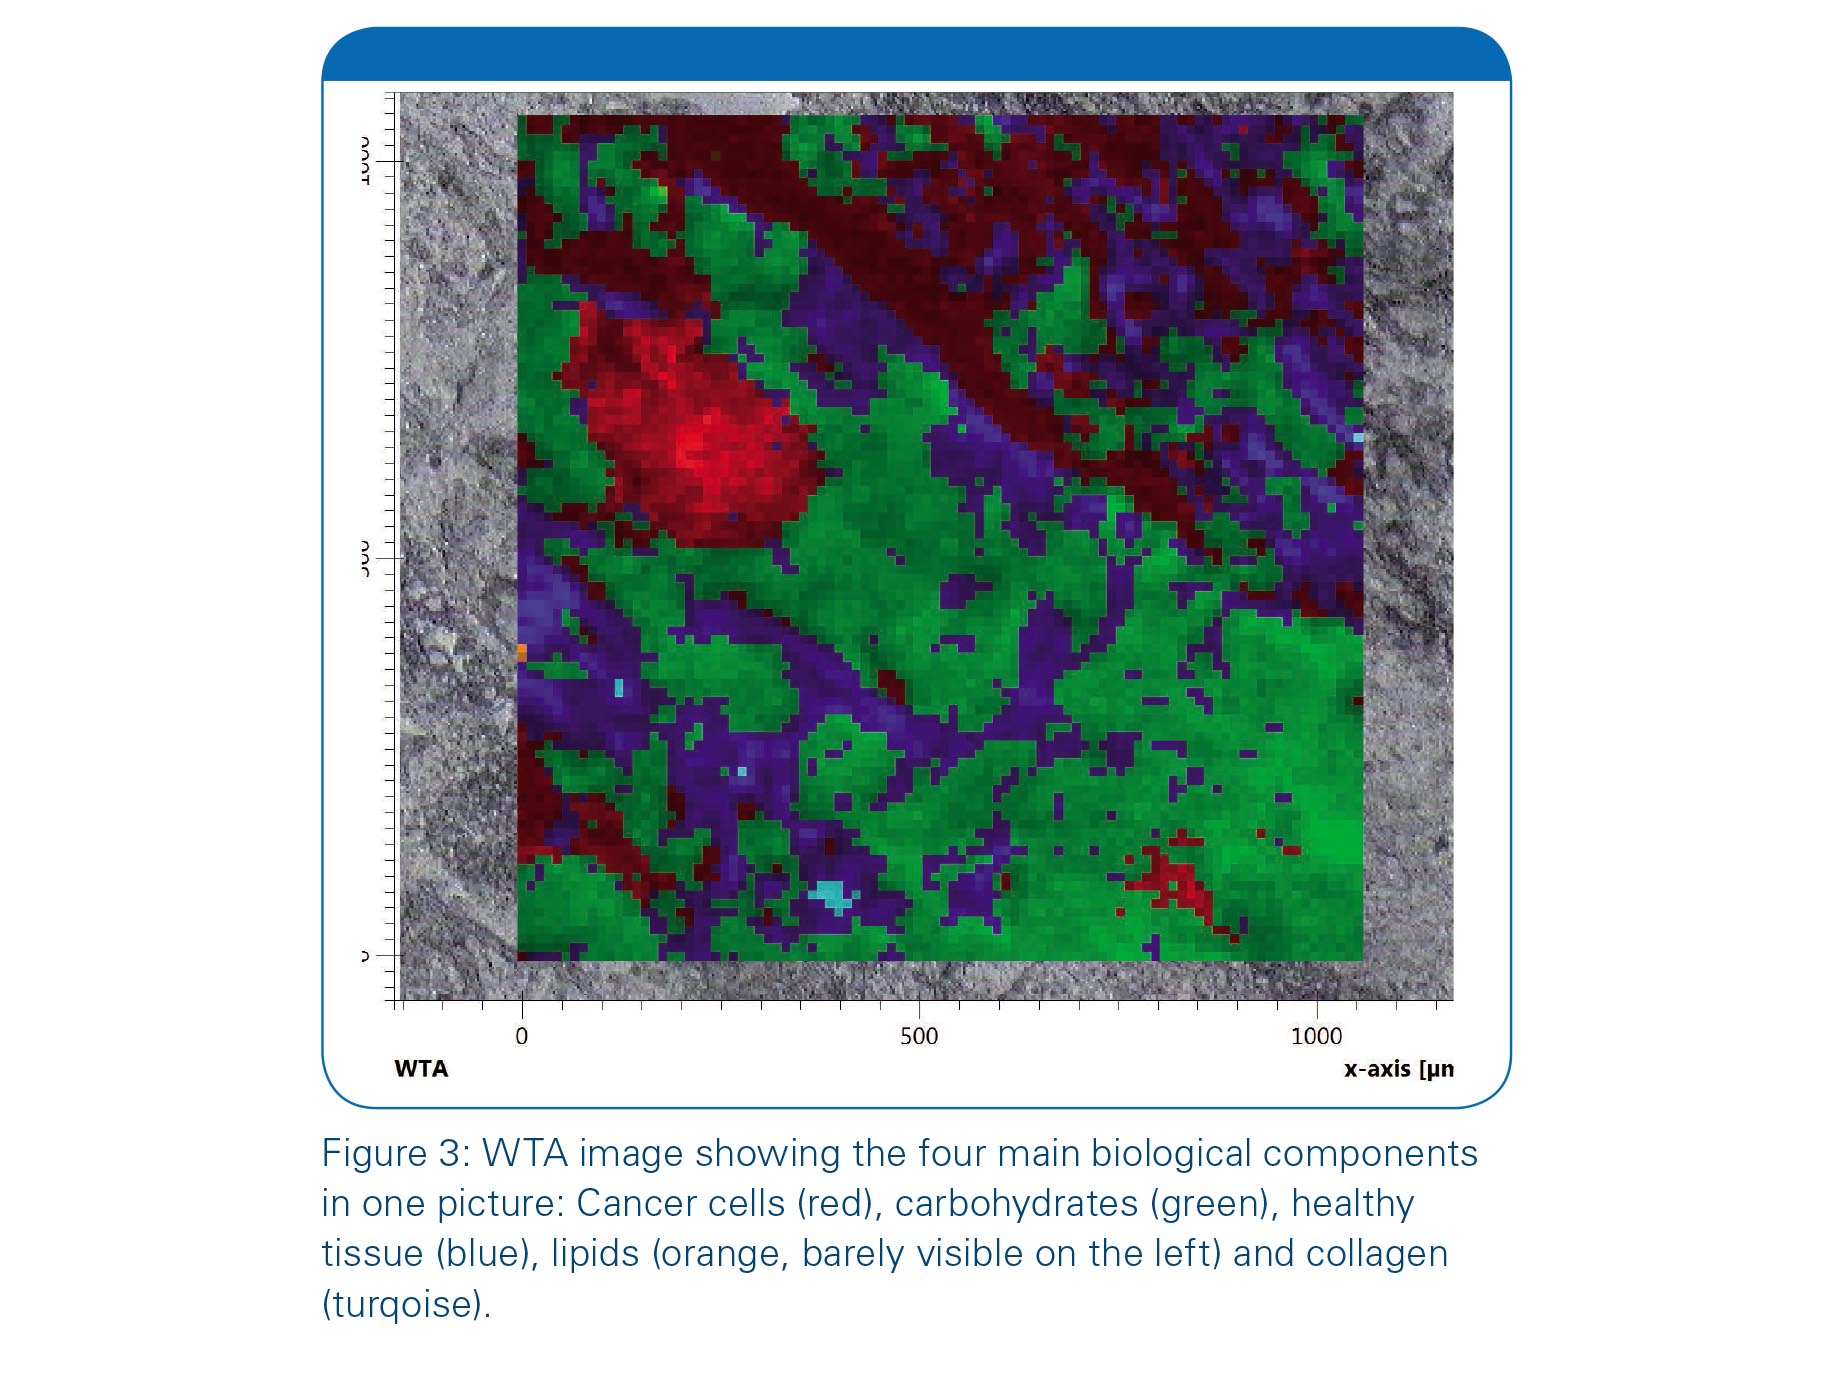
To combine the information of several chemical images each single image/component is assigned to a certain color. In the “Winner Takes It All”-mode, the dominantcomponent is determined for each individual pixel and the respective color is assigned. This type of image is especially useful to illustrate more than one component in one image. Figure 3 shows the combined information where the single components are color coded: Healthy tissue is shown in blue, cancerous region are shown in red, carbohydrate are shown in green, lipids are orange and collagen is shown in turquoise.
Analysis of denatured proteins in a rat brain sample
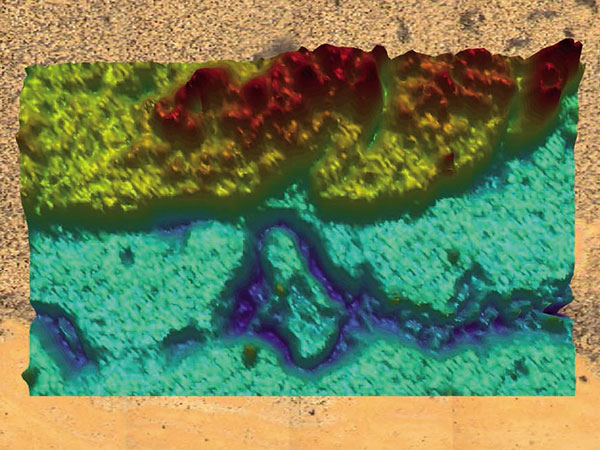
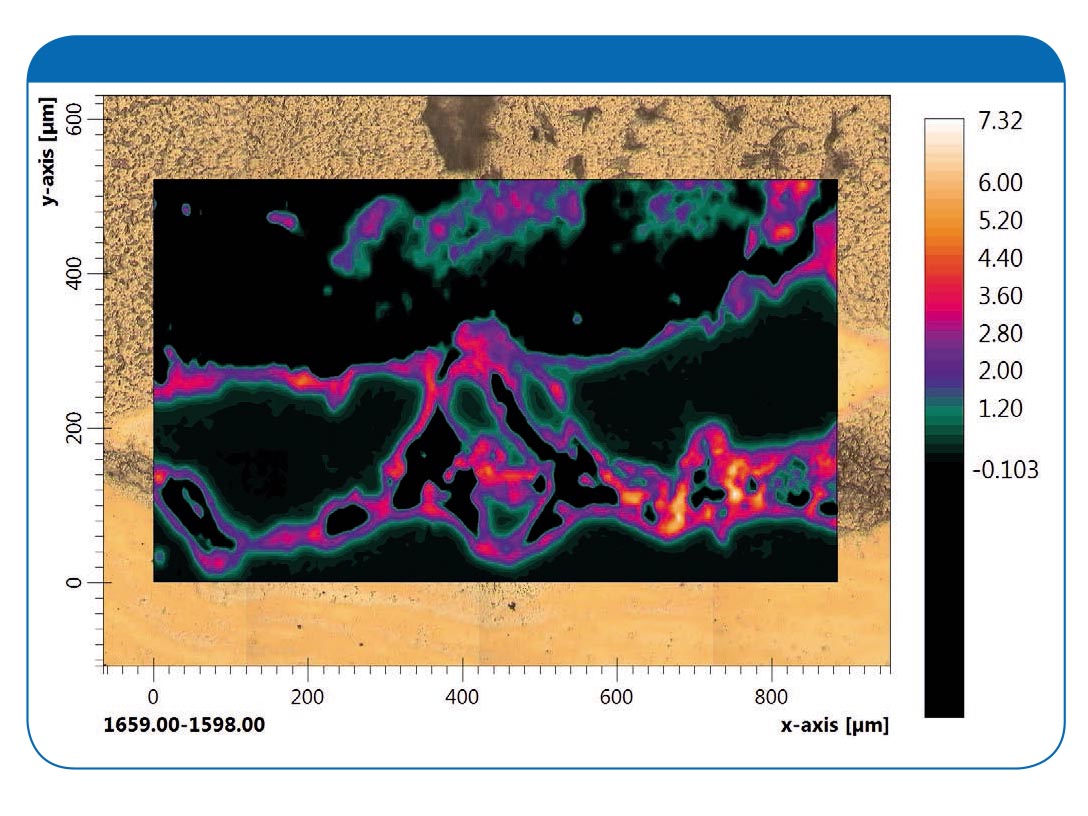
This example shows the analysis of a diseased rat brain. Neurodegenerative diseases typically involve the formation of denatured proteins that differ in their structure from native proteins. For instance in Alzheimer’s disease the Amyloid beta peptide is misfolded and aggregates in the brain in the form of plaques. For the analysis, a microtome section of the rat brain sample was placed on a gold mirror serving as reflective substrate to allow a measurement in reflection mode. A grid of 3 x 5 FPA measurements was performed covering a sample area of about 500 x 900 µm. Fatty acids were determined by integrating the carbonyl band between 1760 and 1710 cm-1. The so called amide I band which results from the peptide bonds in proteins is sensitive to the protein’s conformation and was used to differentiate the native from the denatured protein. Whereas native proteins showed a high spectral intensity between 1698 – 1652 cm-1, denatured proteins were characterized by a shift of the band maximum into the region 1659 to 1598 cm-1. This is a typical band position for proteins aggregated as intermolecular an example, Figure 4 shows the chemical image for the denatured proteins.
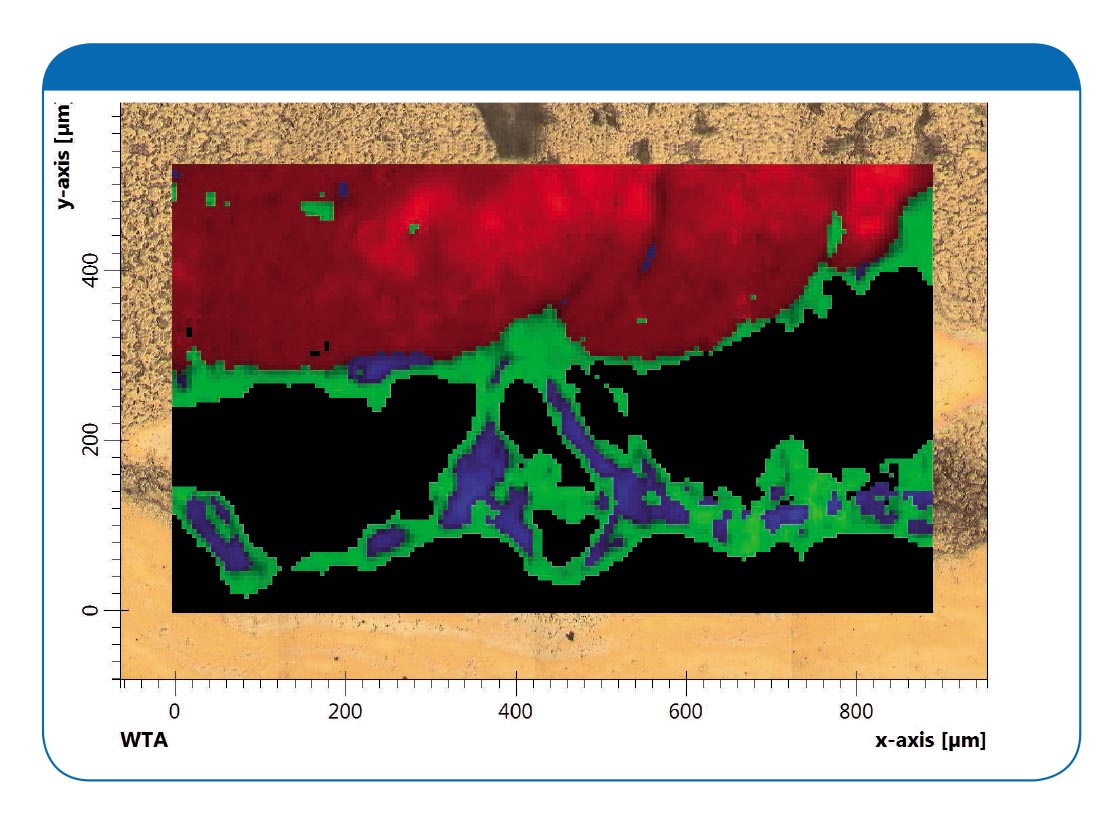
In order to combine all the information about the location of the different tissue types a WTA-image was created. The image in Figure 9 shows the fatty acids in red, the native proteins in blue, and the denatured proteins in green. The native protein regions are all surrounded by denatured proteins suggesting that the protein degeneration is proceeding from the outside of the structures.
Summary
FT-IR imaging is a powerful technique to generate chemical images showing the distribution of the main biochemical components (e.g., lipids, proteins, and polysaccharides) in plant and animal tissue. Moreover, the obtained spectral information allows to differentiate between various properties of the analyzed tissue, including healthy and diseased. As the method does not require any labelling and therefore provides results much faster than current staining techniques, researchers expect it to become a valuable tool for medical diagnostics in future.
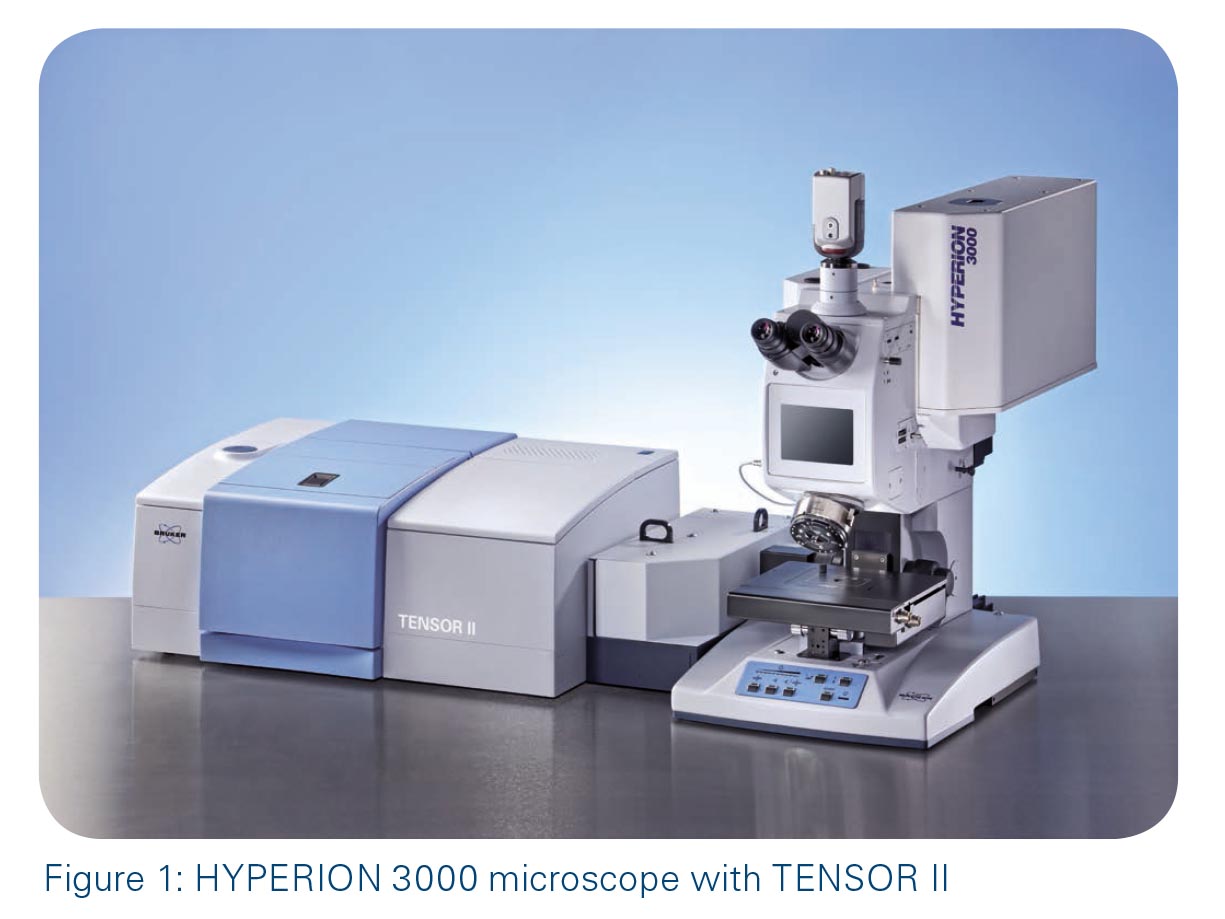
The HYPERION 3000 is an FT-IR imaging microscope providing the maximum sensitivity and resolution power that is required for high-end research applications.
Credit : Bruker Co., Ltd.


|
|
|