Knowledge
Analysis of thin multilayerpolymer films by DSC,TMA,and microscopy

DSC and TMA measurements can be used to characterize the melting behavior of thin multilayer polymer films.
Analysis of thin multilayer polymer films by DSC, TMA, and microscopy
Introduction
The following sections describe the analysis of a colorless, transparent multilayer polymer film. The melting behavior and thickness of the individual film layers were the main points of interest. Thetechniques used were DSC, TMA and visible light microscopy. The results from the different techniques showed good agreement.
Polyethylene (PE) is a thermoplastic polymer produced through polymerization of ethylene. It is a polyolefin and is widely used for cable insulation, packaging materials and many other applications. Polyethylenes in multilayer films ensure mechanical and chemical stability and prevent the uptake of moisture. Besides high molecular weight and ultra-high molecular weight polyethylene, there are three main types of polyethylene. They exhibit different melting behavior [1]:

• PE-LD: strongly branched polymerchains, low density, meltingpoint 110 °C.
• PE-LLD: linear low density PE, melting point 123 °C.
• PE-HD: weakly branched polymer chains, high density,melting point: 135 °C.
Polyamides (PA) are polymers whose repeating unit is based on an amide. The polyamides are produced in a condensation reaction involving a carboxylic acid and an amine with the elimination of water or through addition polymerization of lactams, the ring shaped anhydrides of aminoacids.
The most well-known and widely employed polyamides are PA 6 and PA 66. PA 6 is based on caprolactam, while PA 66 is produced from adipic acid and hexa-methylenediamine. Various other polyamides are also used such as PA 12 and PA 11. The most important applications of polyamides are for the manufacture of textile fibers (stockings, raincoats or sports clothes), technical fabrics (carpet flooring, tennis racquet strings) or household utensils (spoons, ladles). Polyamides have high stiffness and excellent chemical stability [1]. In multilayer films they ensure high strength, expandability and can be thermally molded. Furthermorethey are resistant to heat and cold.
•PA 12: melting point about 180°C
•PA 11: melting point about 186 °C
•PA 6: melting point about 220 to 230 °C
•PA 66: melting point about 260°C
Experimental details
The sample was analyzed by DSC, TMA and microscopy. The instruments used were a DSC 1 with FRS5 sensor, aTMA/SDTA841e with ball-point probe (both from METTLER TOLEDO), and an Olympus PMG3 microscope. The DSC and TMA results were evaluated using the STARe software.
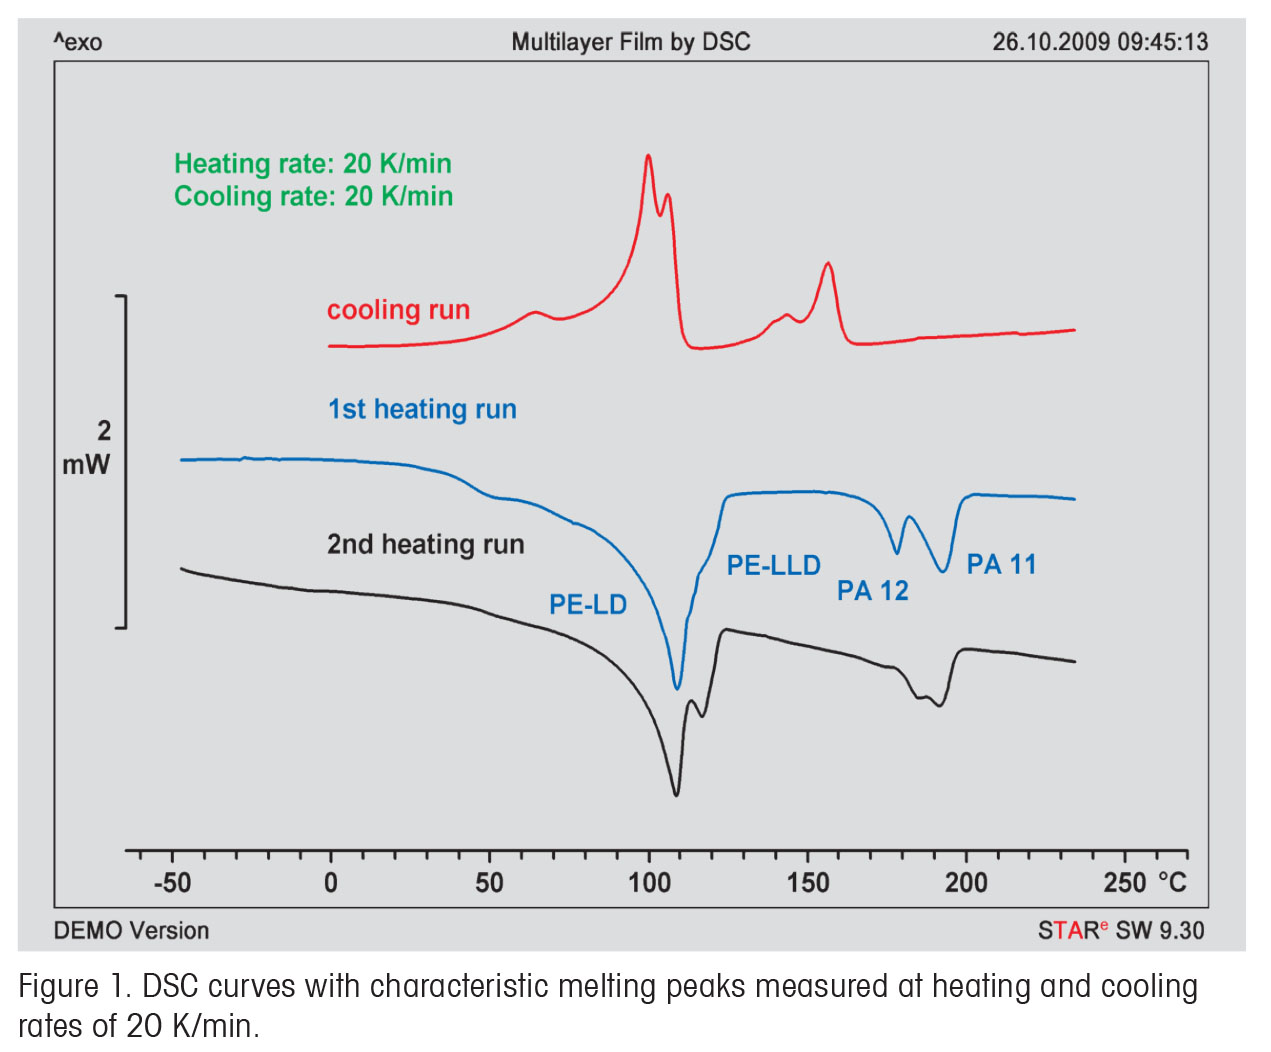
Disks with a diameter of about 2 mm were punched out from the film.The DSC measurement consisted of a heating-cooling-heating experiment inthe range −65 °C to 270 °C using heating and cooling rates of 20 K/min.
In the TMA measurements, the heating rates (5, 10 and 20 K/min) and forces (0.1, 0.5 and 1 N) were varied in order to determine the optimum measurement conditions for the resolution of dimensional changes (steps in the curve).
The TMA probe was in direct contact with the sample in the penetration mode.
The sample for the microscope was prepared as follows: A sample was cut out from the film, cleaned with isopropanol, fixed vertically in a mold and set in epoxy resin. This was then ground, polished and a thin section cut for measurementin the microscope.
Results
DSC measurements
The DSC heating and cooling curves are displayed in Figure 1. The first heating run shows a melting peak at about 108 °C (PE-LD), a shoulder at about 120 °C (PE-LLD), a second peak at 177 °C (PA 12) and the third peak at 191 °C (PA 11). The second heating run of the same sample shows four melting peaks corresponding to four different polymer constituents. The peak temperatures indicate that the multilayer film consists of PE-LD,
PE-LLD, PA 12 and PA 11.
TMA measurements
The TMA curves are displayed in Figures 2 to 4. Evaluation of the first derivative curve in Figure 4 yields peaks at 108, 121, 180 and 194 °C. These temperatures agree well with those observed in the DSC measurements. Figure 2 demonstrates the influence of force on the resolution: the smaller the force, the better the separation of the different meltingpeaks.
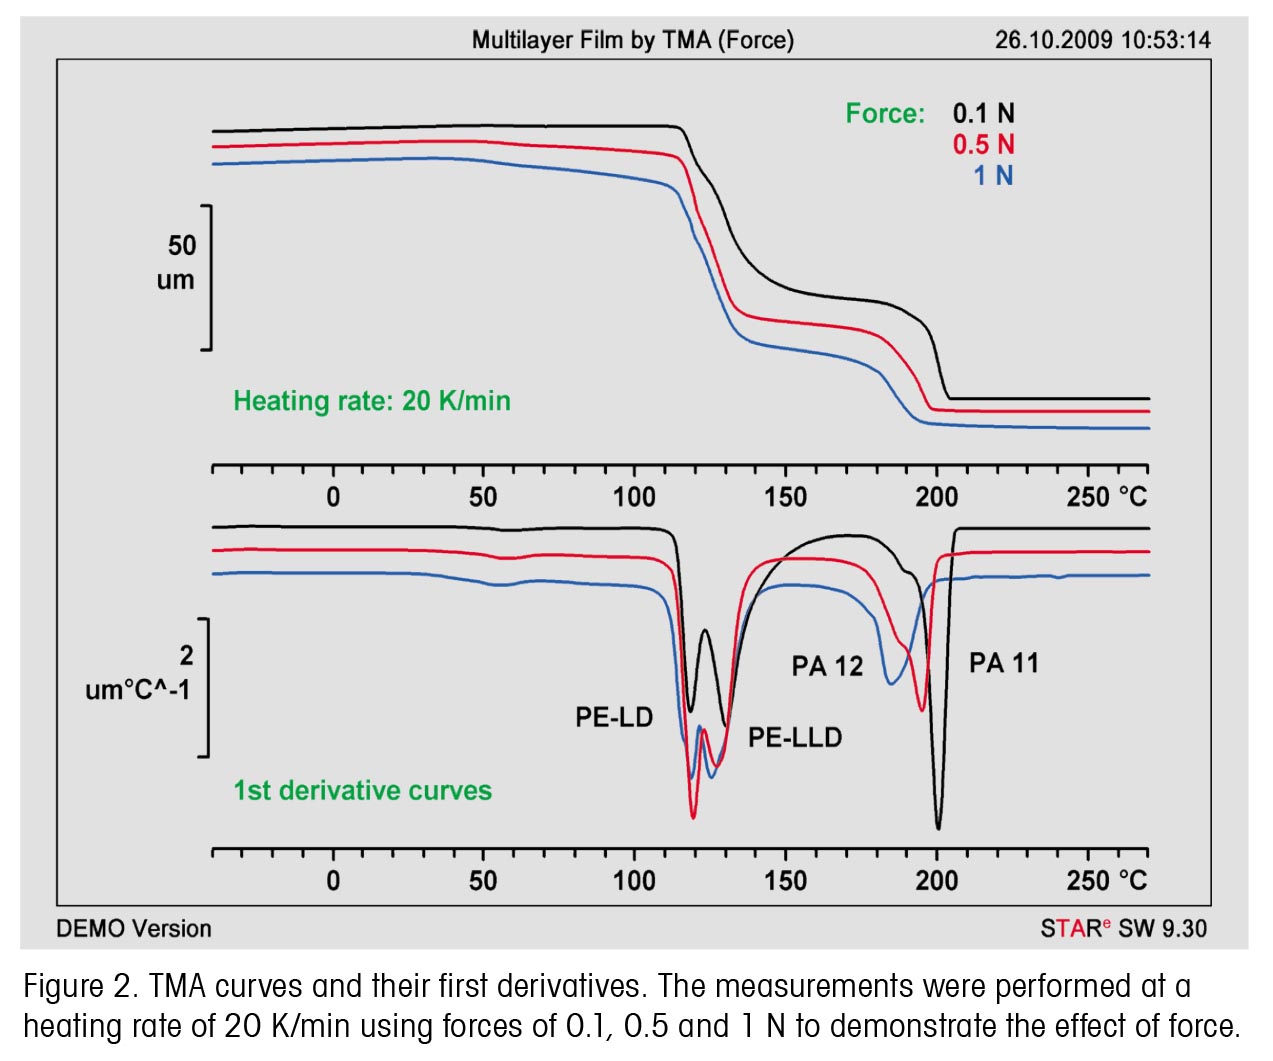
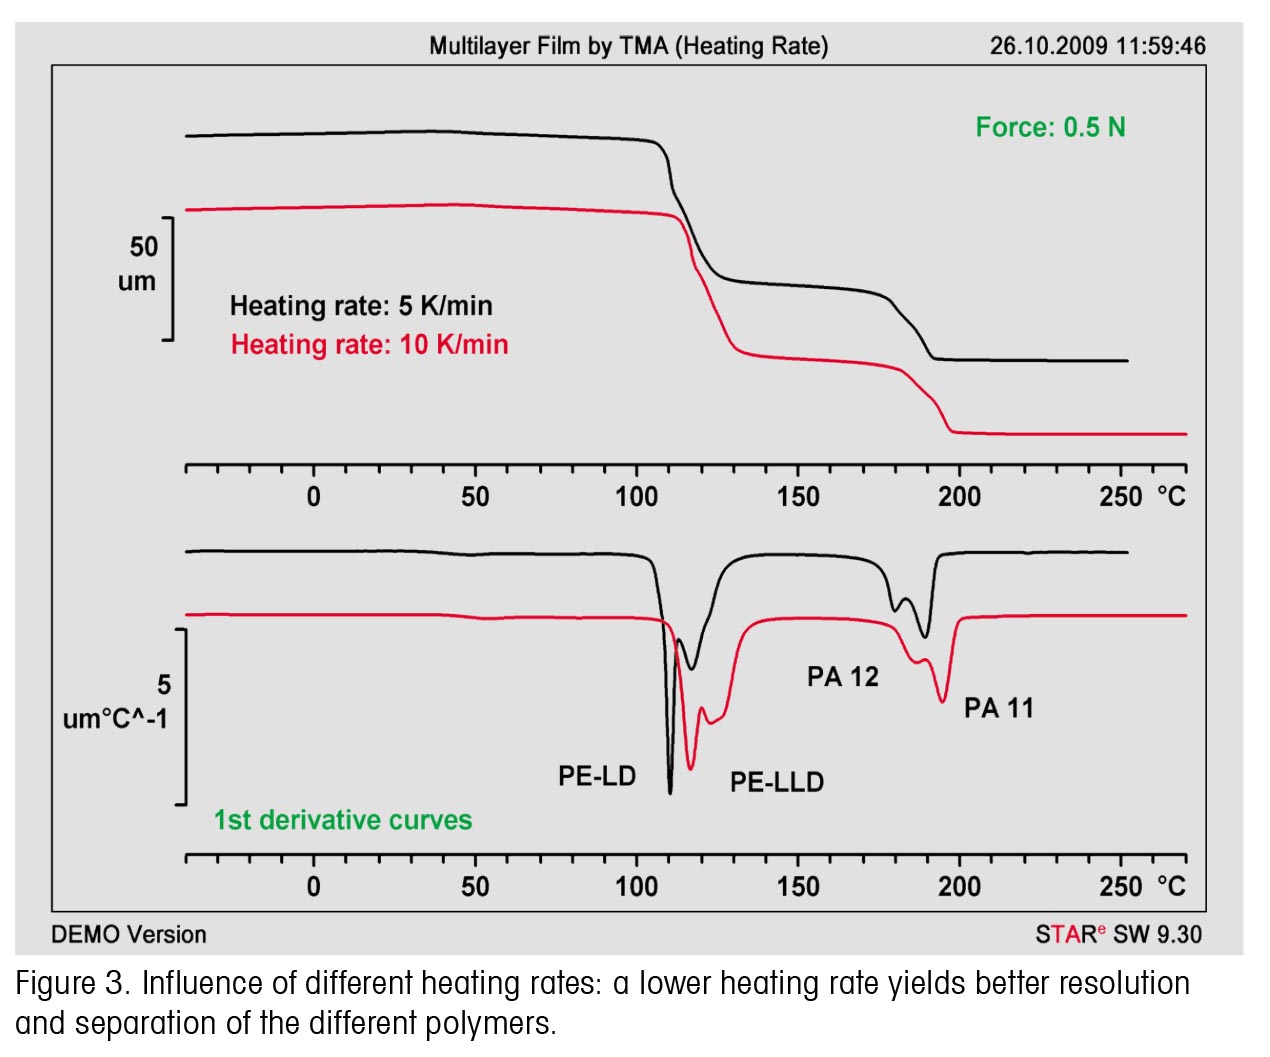
Figure 3 shows the influence of different heating rates: the lower heating rate yields better resolution and separation of the different polymers (according to the first derivative). The TMA curve in Figure 4 was measured using a force of 0.1 N and a heating rate of 5 K/min. The results of this measurement were used to determine the thickness of the individual films of the multilayer film. The evaluation was performed using the first derivative of the TMA curve.
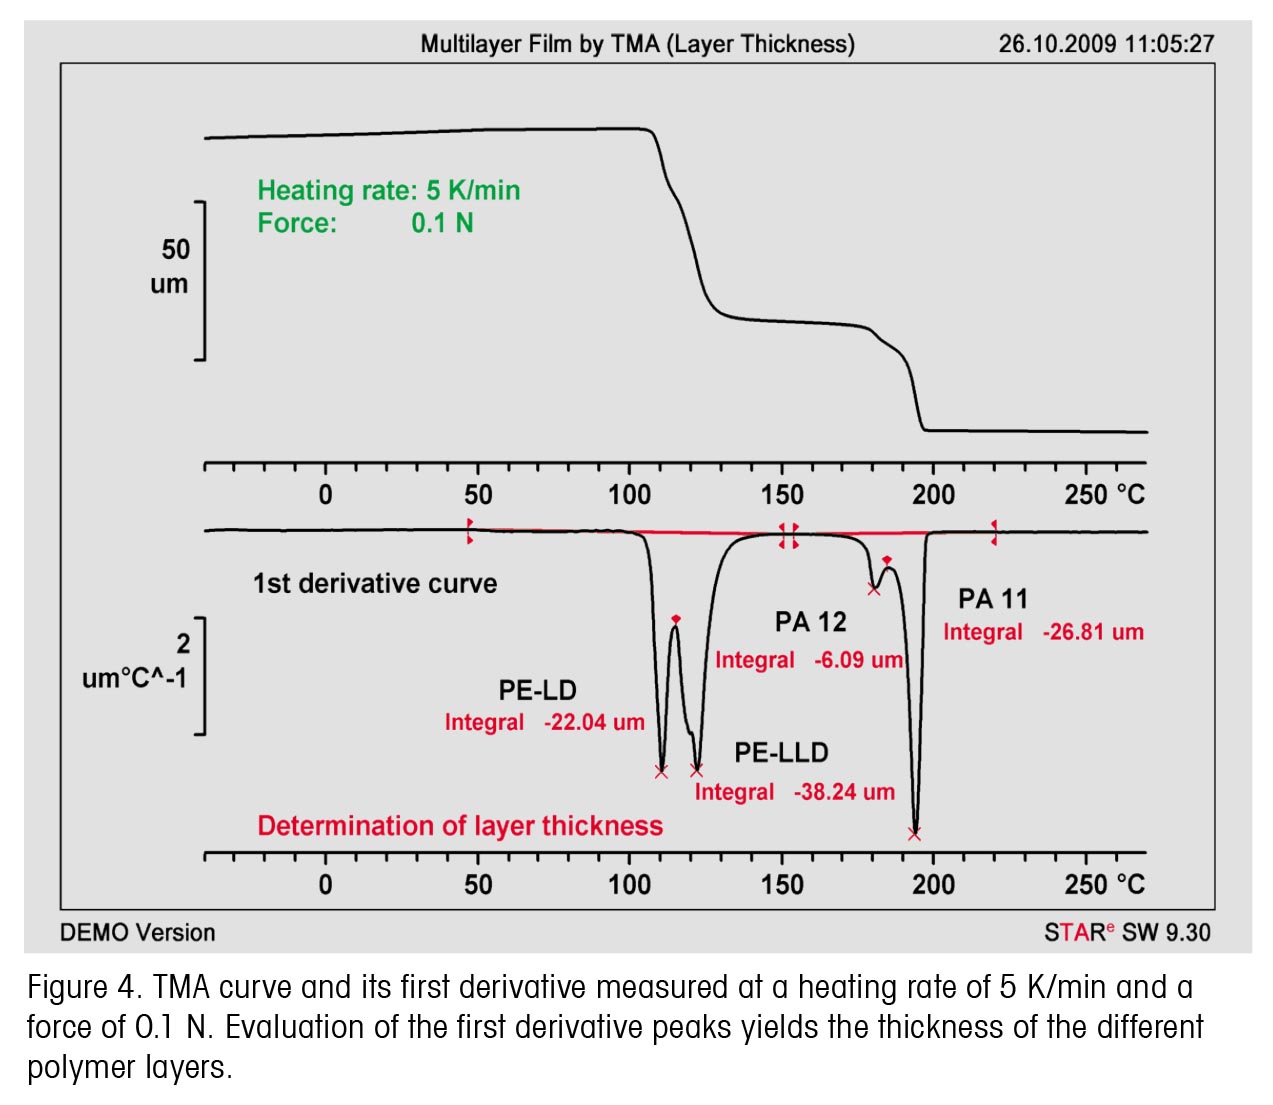
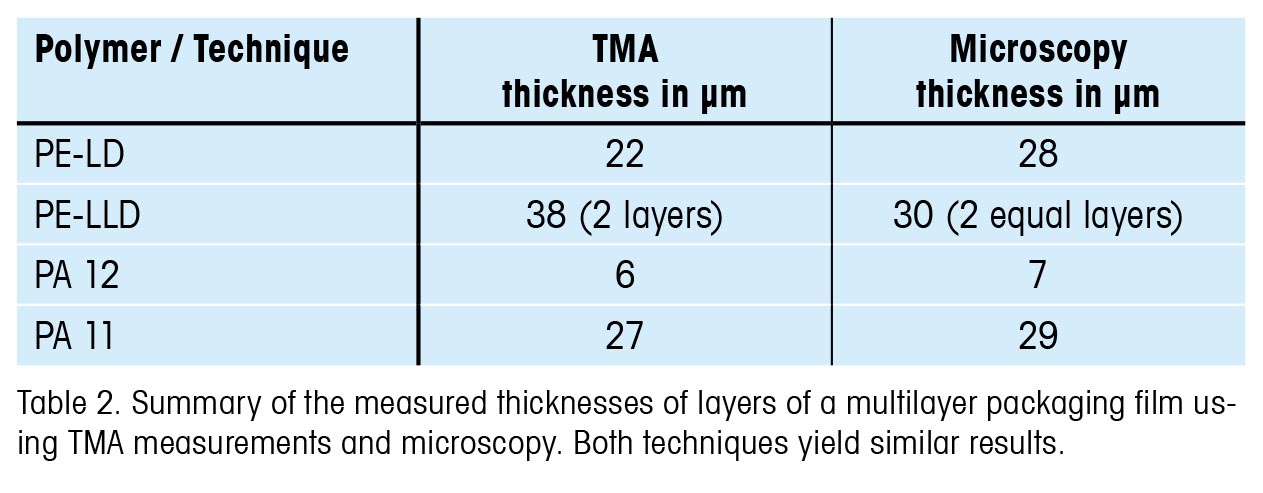
The double peak obtained for PE-LLD (Figure 4) cannot be resolved. It indicates that the multilayer film contains two separate layers of PE-LLD of similar thickness. The evaluation of the three PE layers up to 150 °C is difficult because of the peaks overlap one another. Table 1 shows a comparison of the melting peaks obtained from DSC (Figure 1) and TMA (Figure 4).
Microscope evaluation
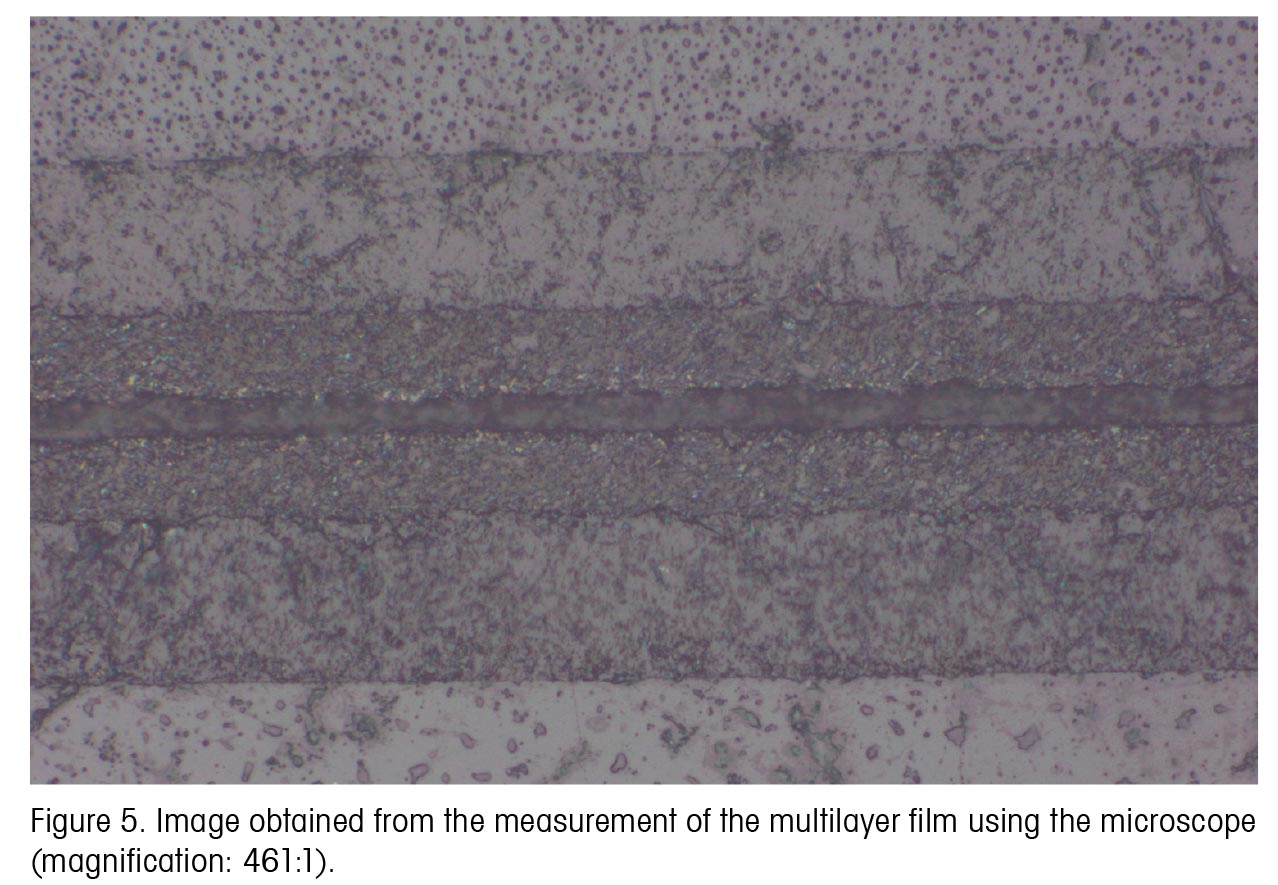
A thin section cut from the multilayer film was measured under a light microscope. The results showed that there were five layers (see Figure 5 and Table 2). Layers 2 and 4 are identical. This indicates that the multilayer film consists of five layers of four different materials. This result confirms the results obtained from the TMA measurements.
Summary
DSC and TMA measurements can be used to characterize the melting behavior of thin multilayer polymer films. This allows the individual polymer constituents to be identified from their peak temperatures. The thickness of the individual
layers can also be determined. Measurements of the individual film thicknesses using a microscope confirmed the results obtained by TMA. This demonstrates that DSC and TMA are excellent techniques to use for checking the quality and composition of multilayer packaging films used in the food industry. A layer with a thickness of less than 10 μm was easilydetected.
Literature
[1] Adolf Franck-Kunststoffkompendium, Vogel Fachbuch, 2000
Publishing Note:
This application has been published in
the METTLER TOLEDO Thermal Analysis
UserCom No. 30.
See www.mt.com/ta-usercoms
Credit : METTLER TOLEDO Co., Ltd.
Contact us
388/5 Nuanchan Road, Nuanchan,
Buengkum, Bangkok 10230
0 2363 8585 (auto)
0 2363 8595
081 498 9939


