

 |
 |
 |
The IR spectra provide information about the chemical identity of the defects and allow to distinguish between different layers.
Packaging materials are often composed of various layers that fulfill different functions. The actual packaging foil has a barrier function and is, depending on its intended purpose, already made from different layers. As foil material mainly polymers are used but also other materials like for instance aluminum. Added are other layers like an adhesive sealing or printing. Defects in such complex multi layered systems like inclusions can result in product malfunctions. Since many of the different materials cannot be distinguished visually and the defects are often microscopically small the selective analysis of these defects is often difficult.
FT-IR microscopy is an attractive method for the analysis of defects. It allows to measure an IR spectrum from structures in the micrometer range at high lateral resolution. The IR spectra provide information about the chemical identity of the defects and allow to distinguish between different layers. With FT-IR microscopy a chemical image of the sample can be recorded showing its compsition and distribution of the defect.
Instrumentation
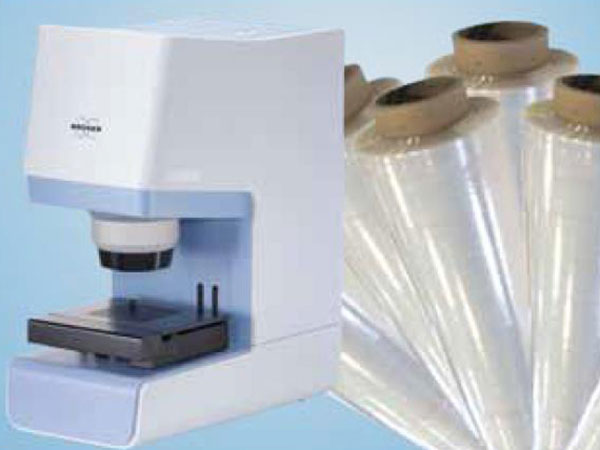
The LUMOS FT-IR microscope (figure 1) is an all in one solution with an integrated spectrometer, a high degree of motorization and a dedicated user-interface. Its 8x objective provides the measurement modes ATR, transmission and reflection with high quality visual inspection capabilities. The innovative motorized Attenuated Total Reflectance (ATR) crystal allows performing the complete measurement procedure fully automated including background and sample measurements. Due to the high index of refraction of the ATR crystal material (Germanium) even very dark materials ar gangeable. A high working distance and the unobstructed access to the sample stage facilitate an easy positioning of the sample. The large field of view of 1.5 x 1.2 mm and the high depth of focus make sample inspection very comfortable. In combination with a motorized stage, fully automated mappings can be performed. The dedicated OPUS Video-wizard is guiding the user through the whole measurement procedure and always provides the most suitable functions for the current measurement step.
Example:
Analysis of the homogeneity of a coating
The second example shows the analysis of a clear and colorless plastic foil which is coated with a layer of melamine resin. The goal was to determine whether the resin layer is covering the whole surface and if there would be defects on one side. Figure 5 shows the 3D evaluation of an area with 1.5 x 2.0 mm in size. Again 1200 Spectra were measured with an aperture size of 50 x 50 μm, a measurement time of 3.5 seconds each and a spectral resolution of 4 cm-1. The evaluation was performed by using factor analysis (PCA) that automatically analyses all the spectra and thereby mainly helps to detect little aberrations like defects, even if these defects are not detectable in the visual image. During factorization the spectra are transformed into a matrix of factor spectra and the associated factor weights called „scores“. The scores are coefficients that show the share of a factor spectrum on a certain measured spectrum. Often a few factors are typically enough to represent the spectral variance of a spectral dataset, higher factors mainly contain noise. For the creation of the image the factor weight of the first factor was used. The 3D-view of figure 5 clearly shows four inhomogeneities whereas the biggest peak also has a visual counterpart in the form of a clearly visible blue spot.
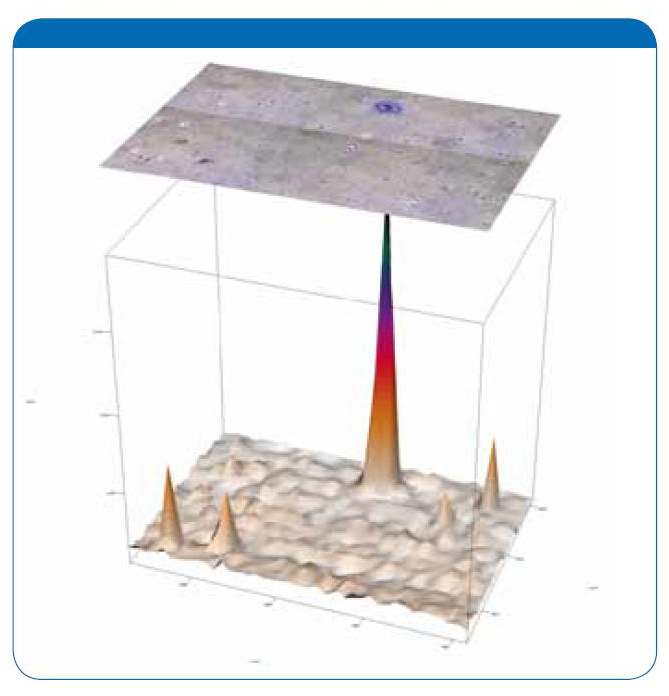
Figure 1: Visual image of the foil (top) with a 3D plot of the first factor score plot showing the inhomogeneities of the sample.
Summary
The LUMOS FT-IR microscope allows to detect and to analyze smallest defects in packaging materials. Beside visual analysis and punctual IR-measurements also fully automated mappings can be performed. Evaluation by functions like integration of bands, factor analysis or 3D-cluster analysis results in chemical images. These chemical images can be graphically analyzed and presented in a variety of ways. With these tools product defects can be identified and their causes be tracked.
Credit : Bruker Co., Ltd.


|
|
|