

 |
 |
 |

FT-IR spectrometer can be used for rapid classification of different essential oils used in the flavour and fragrance industry.
Introduction
Until recently, mid-infrared spectroscopy was primarily used in agricultural research as a qualitative technique for identification and verification of unknown pure substances isolated from extracts or distillates. Usually infrared spectra obtained from plant samples are very complex because each functional group in a molecule contributes more or less to the spectral output. The net result is a spectrum in which band assignments may be difficult due to the fact that overlapping and mixing of various vibrational modes occur. The comparatively new approach to utilize MIR spectra for analysis of plant samples in the same fashion as near infrared spectra provides an additional advantage of spectral interpretability.
Experimental
Mid IR spectra of essential oils were recorded in the range between 375 and 4000 cm-1 with a portable ALPHA FT-IR spectrometer in a single reflection configuration. Spectra were accumulated from 32 scans with a spectral resolution of 4cm-1. The instrument was fitted with a permanently aligned “RockSolid” interferometer and a DLATGS detector. Approx. 2μl of the essential oil were placed on the surface of the diamond ATR crystal. Chemometric analyses of the ATR-FT-IR spectra were performed using the OPUS/ QUANT software. The 375 - 1900cm-1 region was used for the partial least square (PLS) calibration. The accuracy of each calibration statistics was characterised by the overall error between modelled and reference GC data, the root mean square error of cross validation (RMSECV) and the multiple coefficient of determination (R2). Hierarchical cluster analysis was carried out applying the OPUS/IDENT software; the spectral distances were calculated with the standard algorithm after applying baseline correction followed by 1st derivative.
Results and Discussions
Whereas NIR spectroscopic data can be interpreted only by application of chemometric algorithms MIR spectra obtained from the isolated essential oils present characteristic key bands which can be used as marker bands to discriminate different plant species and chemotypes. Generally, those compounds of essential oils occurring only in low concentration (< 1%) do not influence the ATR-IR spectrum significantly. Nevertheless, based on chemometric calculations in most cases qualitative discrimination of different chemotypes is possible and sometimes even different types can be identified by visual evaluation without applying any chemometric algorithm. It has been proved that ATR-IR method can be successfully applied for rapid and reliable discrimination of various basil (Ocimum sp.) chemotypes (Figure 1 and 2).
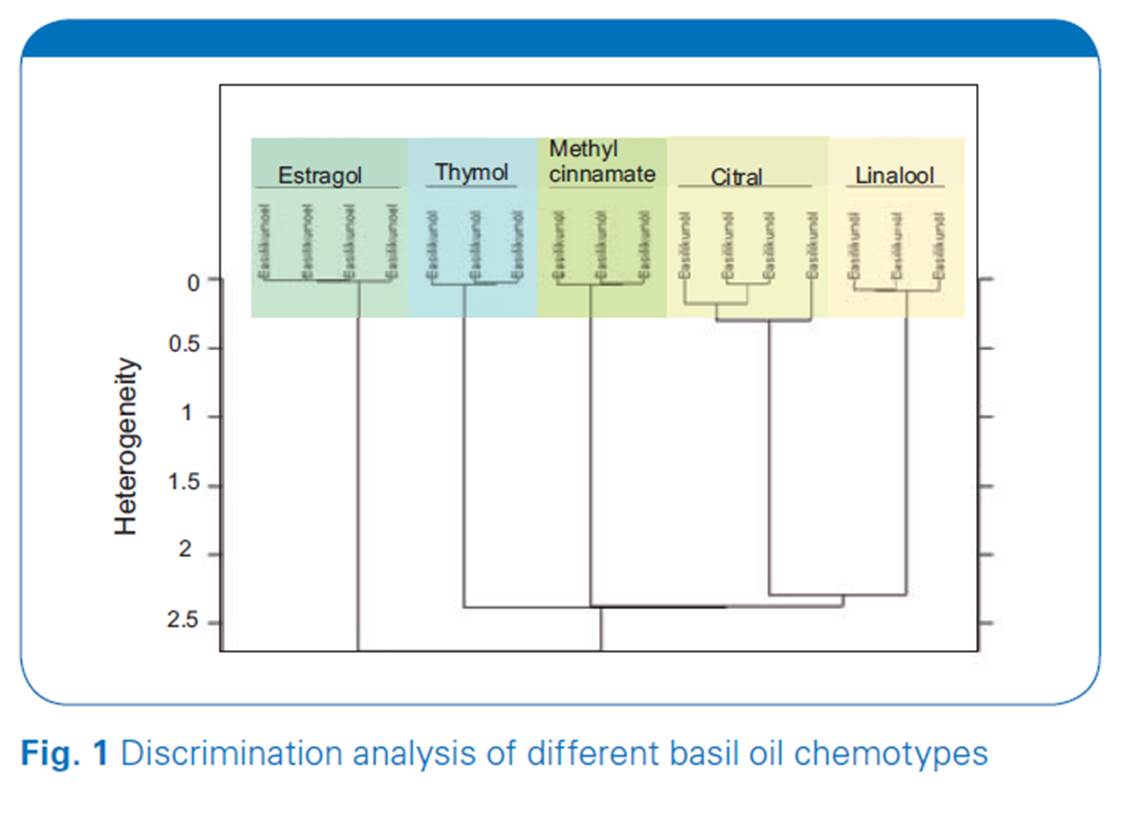
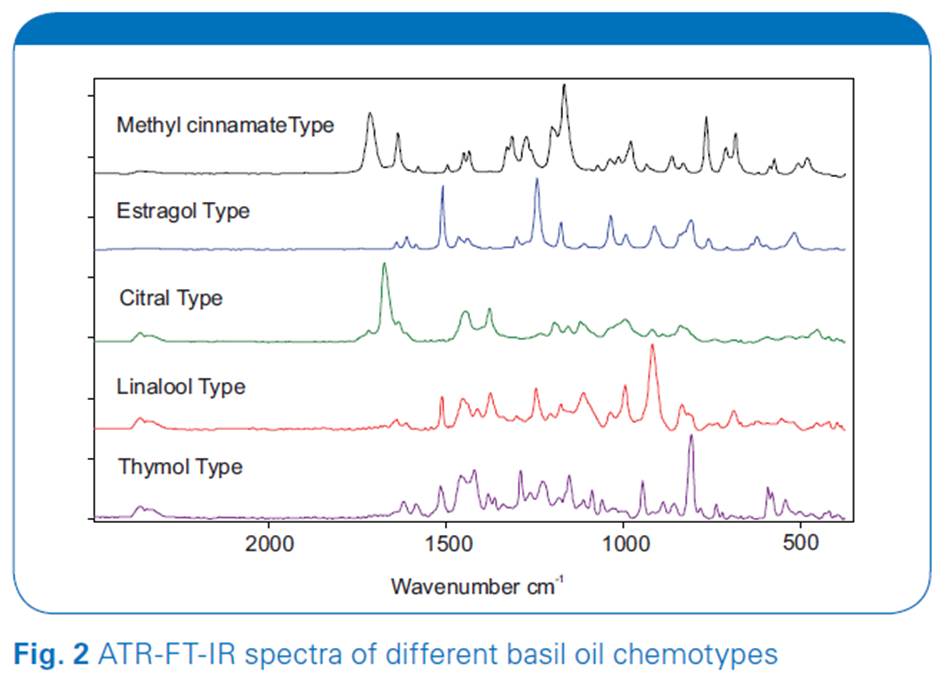
All spectra obtained from different basil essential oils show individual fingerprints and can be discriminated with hierarchical cluster analysis. Application of PLS algorithm resulted in very good prediction quality with SECV values in the same order of magnitude as the standard error of the applied GC reference method.

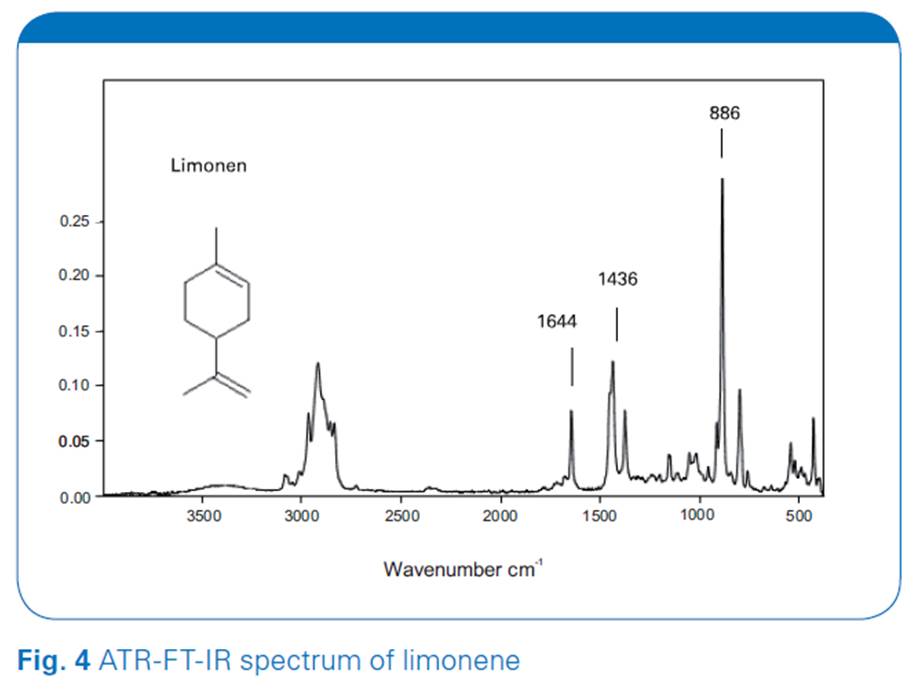
Also classification and quantitative analysis of various citrus oils with ATR-IR spectroscopy can be successfully performed (Figure 3). As limonene is the main component in grapefruit, orange and bitter orange oils and occurs in other citrus oils in amounts of 50-78%, it is not surprising that the MIR spectra of these oils are dominated by the vibrational modes of this monoterpene substance which are registered at 886, 1436 and 1644cm-1 (Figure 4).
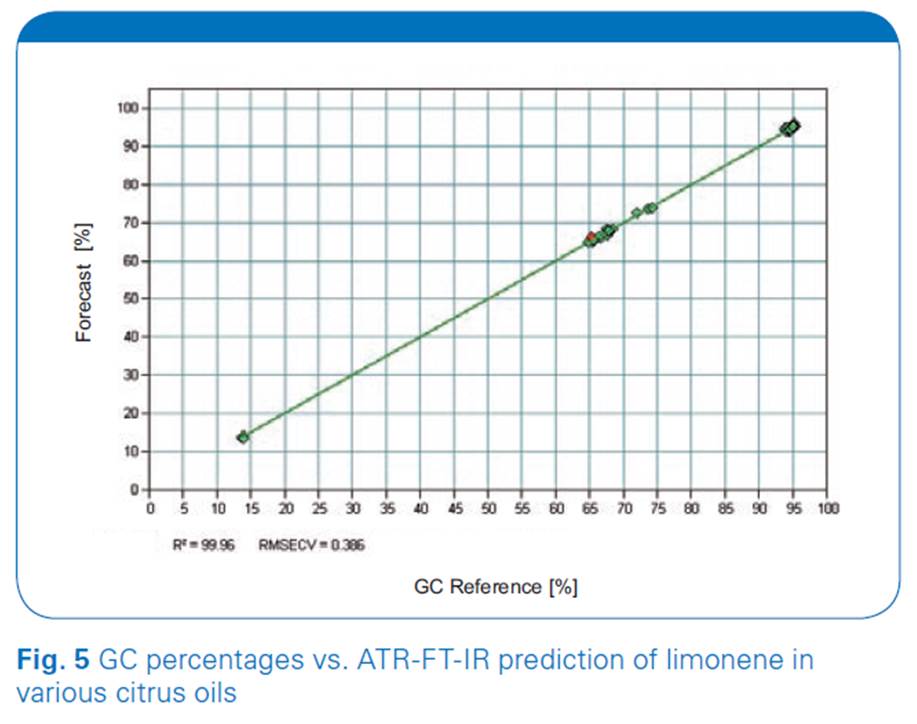
Figure 5 presents reference GC values vs. ATR-MIR prediction of the linalyl acetate content in lavender oil (Lavandula angustifolia), spike lavender oil (Lavandula latifolia) and Lavandin oil (L. angustifolia x L. latifolia). Based on this calibration a clear discrimination of different lavender and lavandin oils offered in the market is possible. Furthermore, the individual content of main components (e.g. linalool, linalyl acetate, 1,8-cineole, camphor) can be reliably determined.
Conclusion
The new portable ATR-FT-IR spectrometer presented here can be used for rapid classification of different essential oils used in the flavour and fragrance industry. In combination with micro-hydrodistillation on-site measurements of essential oil plants collected from natural habitats can be performed. Furthermore, ATR-FT-IR spectroscopy has the potential to replace partly gas chromatography methods in industry to control very easily essential oils as well as to support purifying, blending and re-distillation processes.
Credit : Bruker Co., Ltd.


|
|
|