

 |
 |
 |
FT-IR microscope allows to examine large dimensioned samples without the need for a complex sample preparation.
Introduction
The analysis of large samples with FT-IR microscopy is often a challenging task since most FT-IR microscopes are not designed to handle oversized samples. Therefore, many specimens have to be cut in order to fit under the microscope, but often the destruction of the sample piece is not an option or at least not easy to perform. Also very structured samples can pose a problem when the microscope has a low working distance and deeper areas of a structured sample cannot be focused anymore. The fully automated IR-Microscope LUMOS has an excellent accessibility of the sample stage and a large working distance of 30 mm. Samples with a thickness of up to 40 mm can be investigated without any changes of the hardware. Due to these features larger samples can be analyzed without sample preparation, saving your precious working time.
Instrumentation
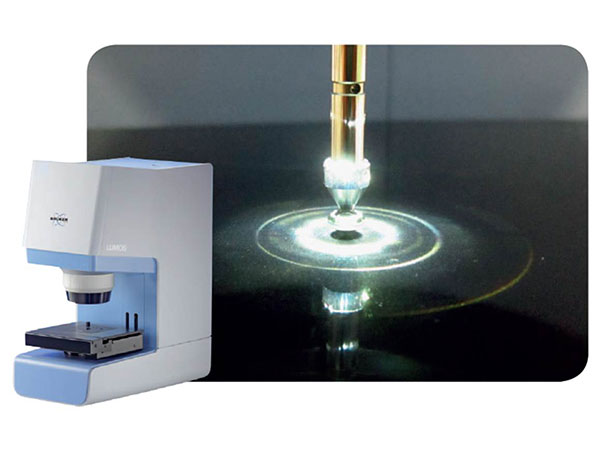
The FT-IR microscope LUMOS is an all in one solution with an integrated spectrometer. Due to the motorization of all moveable components inside the LUMOS, the system provides a high degree of automation. It is utilizing state-ofthe- art optics for optimal sample visualization and infrared data collection. Its 8x objective provides the measurement modes ATR, transmission and reflection and high quality visual inspection capabilities. The innovative motorized Attenuated Total Reflectance (ATR) crystal facilitates procedure completely automated data acquisition including background and sample measurements. In combination with the motorized stage, fully automated mappings can be performed.
Besides the automated hardware the software provides a very elegant wizard based operating concept. The user is guided through the whole measurement procedure by the dedicated OPUS video-wizard, a user interface that always provides the appropriate functions for the current measurement step. Although the LUMOS is designed to be operated by non-experts for routine applications, its exceptional sensitivity makes it also very suitable for high demanding applications.
For the LUMOS both manual and motorized sample stages are available. The motorized xy-stage is required if the sample needs to be analyzed automatically at different positions or if infrared images shall be acquired. Due to its large adjustment range (75 x 50 mm) and its high adjustment accuracy (0.1 μm) this stage is very suitable for analyzing even larger areas at high lateral resolution. This stage can be controlled by joystick or software according to the personal preferences of the operator.
Example: Analysis of the tips of a long metal needle
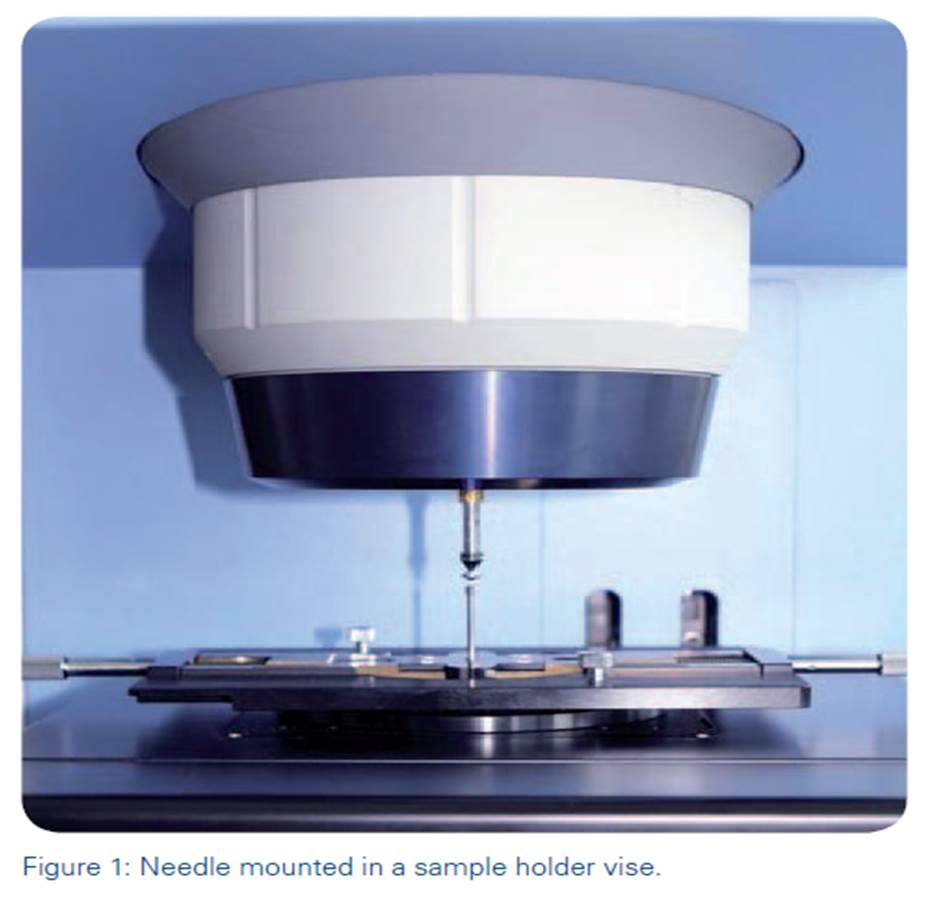
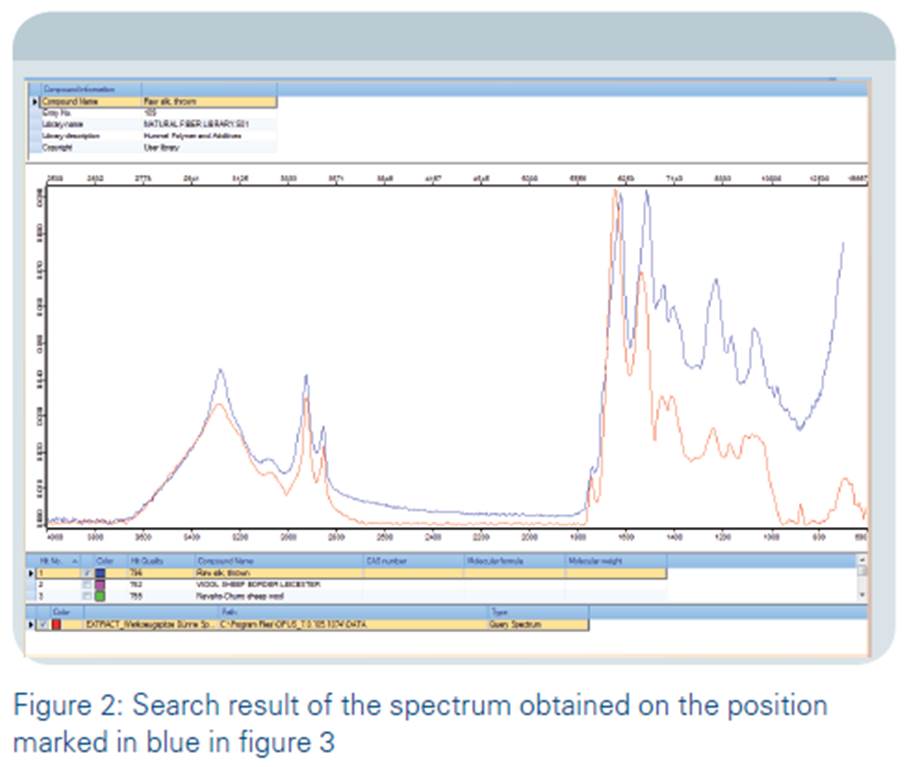
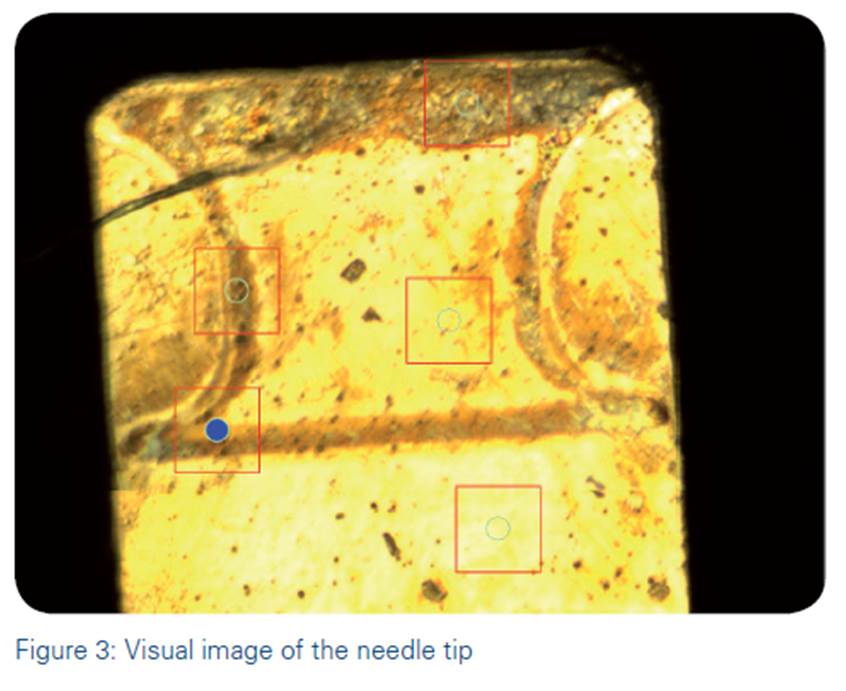
In this example we show the analysis of a long steel needle that is used as stamping tool. As the cleanness of the tips had to be examined, the needle was mounted vertically into the sample holder vise. Figure 1 shows the needle together with the vise on the sample stage of the LUMOS. Despite the fact that the needle was mounted vertically, it was still possible to take high quality visual images and to measure ATR-spectra on different positions on both tips. Figure 2 shows the result of a measurement on one of the tips which has an area of about 1.2 x 0.8 mm. Altogether five measurement spots were measured with aperture sizes of 125 x 125 μm. In Figure 3 the measurement positions are indicated together with the knife edge aperture positions shown as red rectangles. Most of the spectra showed a flat lines that is typical for metals, but in the cavities there were strong bands of contaminations visible in the spectra. An example can be seen in Figure 2.
Example: Analysis of large car parts
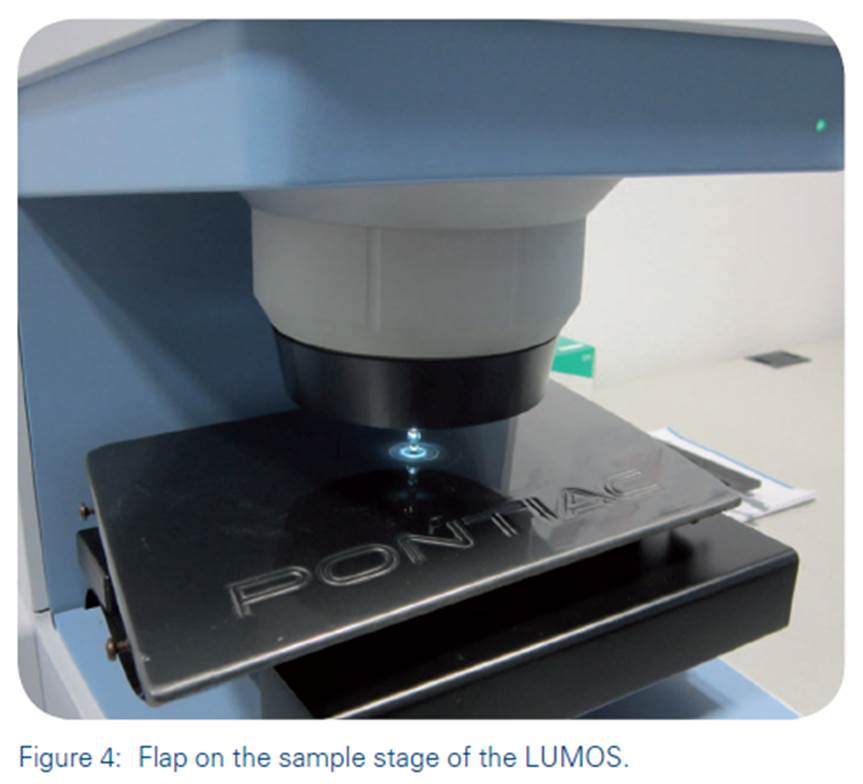
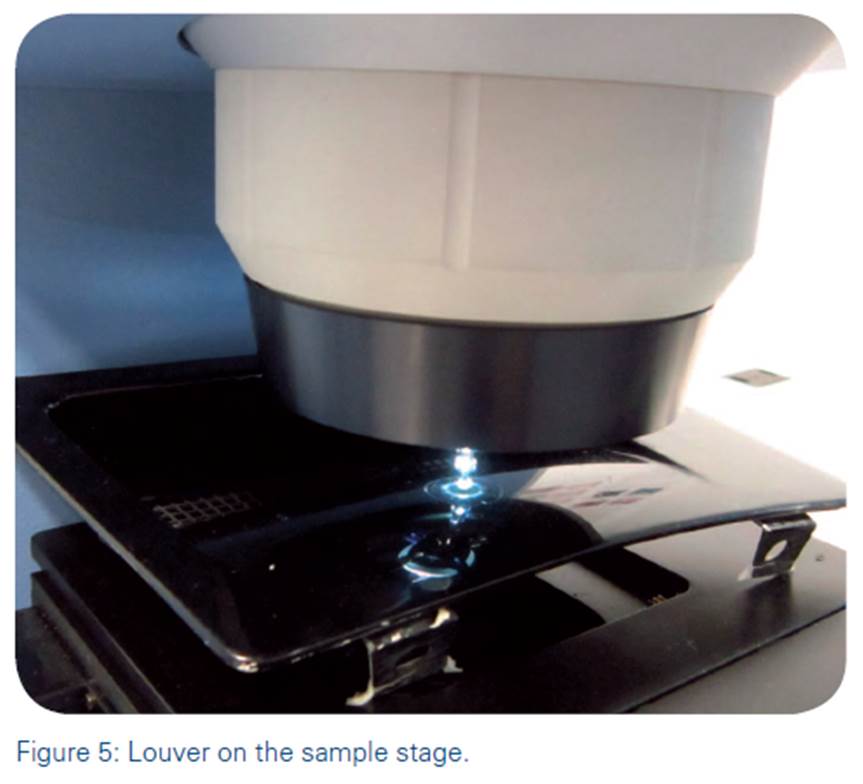
In quality control purposes and for forensic analysis it is often required to examine bulky car parts. As an example we show the analysis of two parts of a Pontiac Trans-Am that were directly measured without any sample preparation. Figure 4 shows a flap of a pop-up headlamp which was fixed on the sample stage with some double-faced adhesive tape. Additionally a fender vent air extractor (“louver”) with a paint defect in form of a barely visible black spot was analyzed. Figure 5 shows the measurement setup. On both samples mappings were performed in order to visualize the surface via chemical imaging.
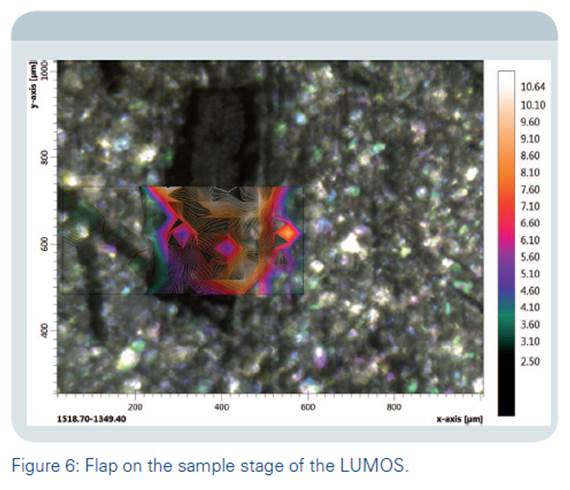
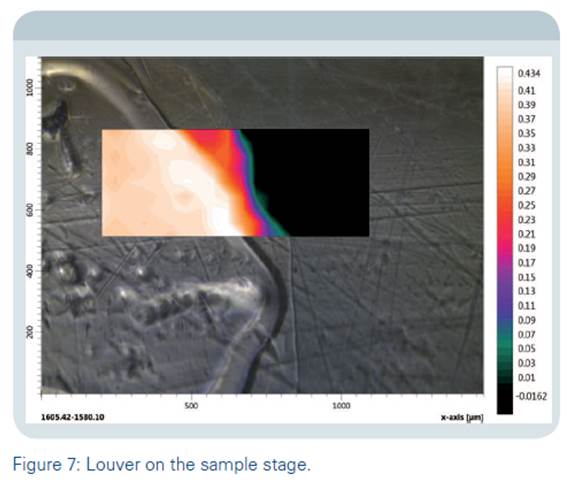
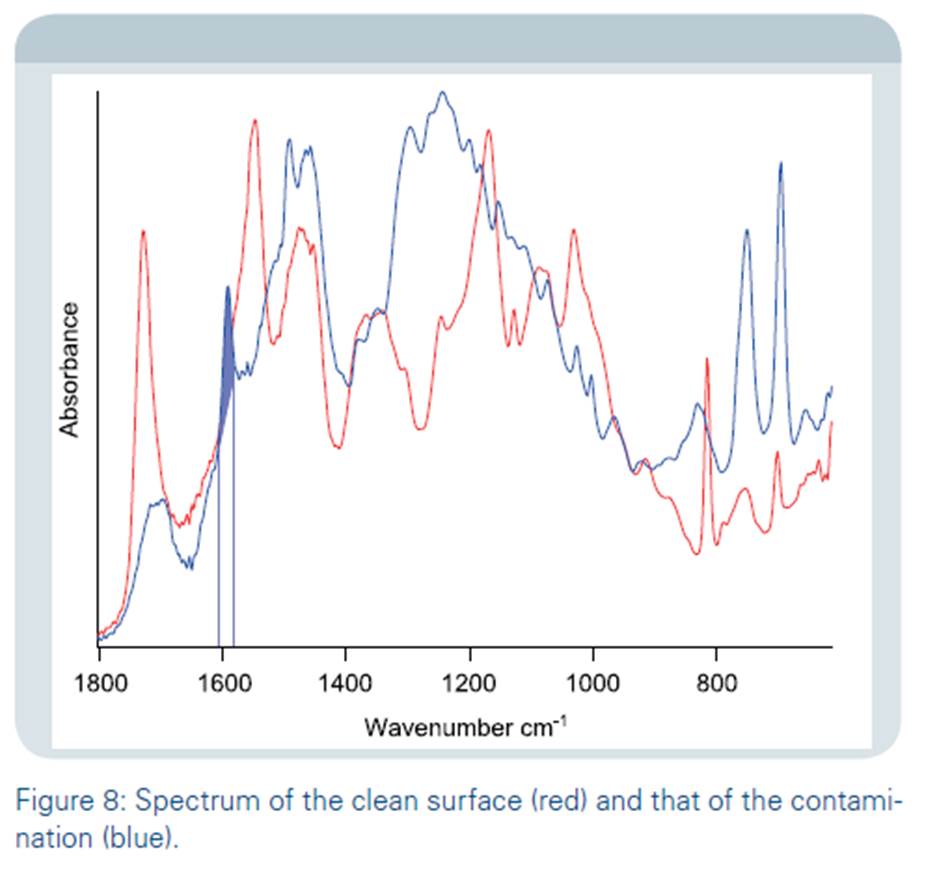
The analysis of the surface on the flap can be seen in figure 6. A small defect was identified on the surface that is covered with an acrylic layer. Altogether 8x17 spectra with an aperture size of 35x35 μm were recorded. The spectra of the defects show a characteristic band between 1519 and 1349 cm-1. The integration values of this band are color coded and superimposed over the visual image. This so called chemical image shows the distribution of the defect that represents most probably the layer below and could be identified via a library search as a highly filled and softened copolymer. Figure 7 shows the microscopic image superimposed with the chemical image of the louver surface: On the left side the contamination can be seen, on the right the clean surface is visible. A mapping with 9 x20 spectra at an aperture size of 40 x 40 μm was performed. Again a characteristic band (1605 – 1580 cm-1) was used as an integration area. The resulting chemical image fits perfectly to the visual image and clearly enhances the contrast. Furthermore it provides information about the concentration gradient of the contaminant. Figure 8 shows the spectrum of the clean surface in red and that of the contamination in blue. It can be seen that the integration band only appears in the contamination spectrum. The integrated area below that band is marked in blue. Another example for a band that is exclusive for the clean surface is located around 810 cm-1. Finally a library search reveals that the contamination is from a black endorsing ink and that the louver is coated with a clearcoat finish.
Summary
The FT-IR microscope LUMOS allows to examine large dimensioned samples without the need for a complex sample preparation. The large size and adjustment range of the sample-stage and the huge working distance are the key elements of the LUMOS when it comes to the analysis of large samples. With tools like chemical imaging and the library search it is possible to visualize and identify defects and contaminations. With the aid of a special sample vice it is even possible to measure very tricky samples like the tip of a needle.
Credit : Bruker Co., Ltd.


|
|
|